Geoscience > Main Launcher > Launch Menu > Basemap > General Properties > Grid Properties > Line and Ribbon for Grids
Grid Properties: Line / Ribbon
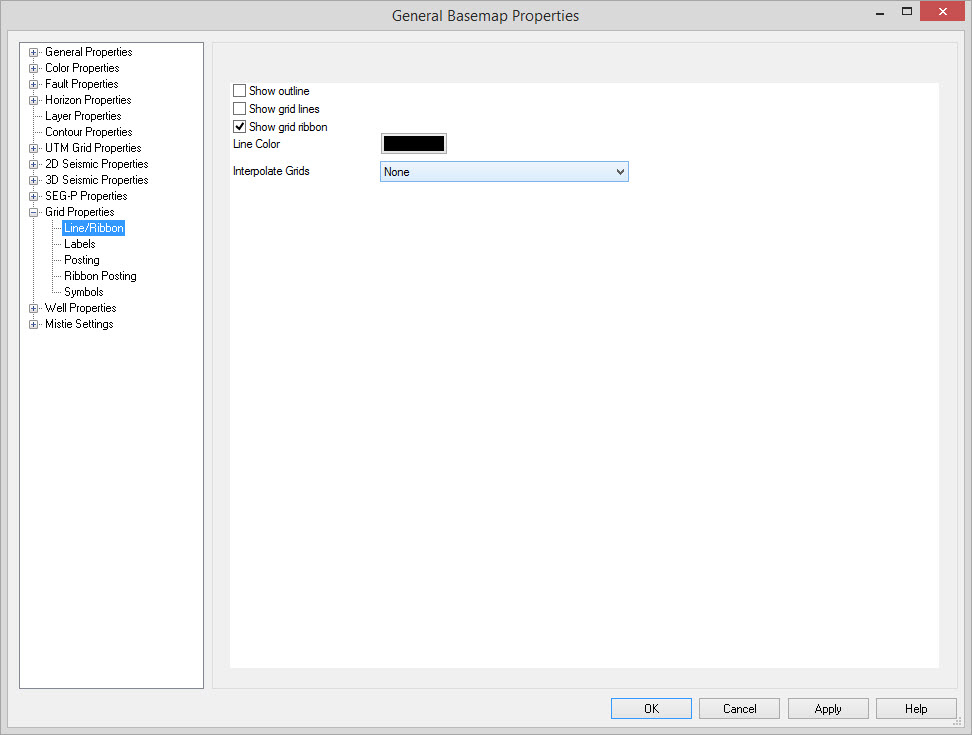
Use these settings to configure the appearance of the grid as it is
drawn on the map.
Enable Lines
Show outline: Shows
the outline of the grid.
Show grid lines: Shows the vertical and horizontal lines that mark where the grid values are. A grid value exists at each intersection of a vertical and horizontal line.
Show grid lines: Shows the vertical and horizontal lines that mark where the grid values are. A grid value exists at each intersection of a vertical and horizontal line.
Line and Ribbon Parameters
Show grid ribbon: Turn
this on to enable grid ribbon display. This will only apply if a grid
has been selected for display from Layer Properties, or from the Grid
toolbar.
Line Color: Specifies the color with which to display the grid outline and grid lines.
Interpolate Grids: This option will enable bi-cubic spline interpolation resulting in a much smoother appearance for the grid. However, in regions of large discontinuity (e.g. fault edges) artifacting is likely to occur, resulting in grids with an inferior overall appearance. The higher this setting is (e.g. super fine), the slower the map will redraw, the larger the output hard copy file will be, and the longer it will take to print.
Also See
— MORE INFORMATION

|
Copyright © 2020 | SeisWare International Inc. | All rights reserved |